Troubleshooting
Overview
This page is split into two parts: tools to identify issues and checklists to resolve them.
Solutions:
- FAQ - short answers to common questions.
- Checklists for troubleshooting - step-by-step guidance for more complex issues.
Tools:
- Health endpoint - the best starting point for troubleshooting your node.
- SSV-Pulse benchmarking - helps identify likely infrastructure or client bottlenecks.
- SSV-Pulse log analysis - analyzes
debug.logfiles from one or more SSV nodes.
FAQ
How do I update my node?
Docker compose:
Run the following commands to update your node to the latest version:
docker compose down
docker pull ssvlabs/ssv-node:latest
docker compose up -d
Alternatively, you can pin an exact version in docker-compose.yaml, for example image: ssvlabs/ssv-node:v1.2.3. If you do, update that version manually whenever a new release is published on SSV Docker Hub.
Docker run:
If you followed our documentation, your container is named ssv_node with the --name=ssv_node flag. Use that name in the Docker commands below.
To update your SSV Node:
docker stop ssv_node
Then remove the container. This does not remove your data:
docker rm -f ssv_node
Pull the latest image:
docker pull ssvlabs/ssv-node:latest
Then run the creation command again to create a new container from the updated image.
What happens if my machine restarts?
In the Docker command you used to start the node, you should see:
--restart unless-stopped
This means Docker will try to restart the container if it crashes or if the machine restarts.
Details
My node is not attesting
If your node is not participating in cluster consensus, check the following:-
Verify that
networkin the config matches the blockchain you want to operate on. -
Verify in the SSV Node logs that connections to the Execution and Beacon nodes were established.
-
Check the private key and password file paths. Also verify the files themselves. In the private key file, the
pubKeyvalue must exactly match the public key registered for this Operator. -
If the SSV Node logs look healthy, check the Execution and Beacon client logs. Slow disks or low IOPS can prevent them from staying in sync.
-
If the issue continues, try re-syncing SSV by deleting the
dbfolder. If that does not help, re-sync the Execution or Beacon client, then re-sync SSV Node again. -
If you still cannot identify the cause, ask for help in the Discord channel.
How do I start the node?
If your node stopped, do not run the full creation command again. Docker will return an error because the container already exists.
Your node container is named:
--name=ssv_node
Use this name in other Docker commands.
To start the container, run:
docker start ssv_node
How do I stop the node?
Your node container is named:
--name=ssv_node
Use this name in other Docker commands.
To stop the node, run:
docker stop ssv_node
How do I view the logs again?
Your node container is named:
--name=ssv_node
Use this name in other Docker commands.
To view the logs while the node is running, use:
docker logs ssv_node
How do I migrate raw (deprecated) Operator Keys
If you already have raw (unencrypted) Operator keys, copy the private key into a text file that contains only the key on a single line. In this example, the file is named private-key.
Password file
Create a file named password with the password you want to use for the Secret Key:
echo "<MY_OPERATOR_PASSWORD>" >> password
Secret Key encryption
Then generate a keystore with:
docker run --name ssv-node-key-generation \
-v "$(pwd)/password":/password \
-v "$(pwd)/private-key":/private-key \
-it ssvlabs/ssv-node:latest /go/bin/ssvnode generate-operator-keys \
--password-file=/password  --operator-key-file=/private-key && \
docker cp ssv-node-key-generation:/encrypted_private_key.json \
./encrypted_private_key.json && \
docker rm ssv-node-key-generation
Configuration update
Next, update config.yaml. Remove the OperatorPrivateKey line completely and replace it with:
KeyStore:
  PrivateKeyFile: <ENCRYPTED_PRIVATE_KEY_JSON> # e.g. ./encrypted_private_key.json
  PasswordFile: <PASSWORD_FILE> # e.g. ./password
Replace ENCRYPTED_PRIVATE_KEY_JSON with the encrypted private key file you just generated, for example encrypted_private_key.json. Replace PASSWORD_FILE with the file that contains the password used to encrypt it, for example password.
Restart node and apply new configuration
Restart the node so the new configuration takes effect:
docker stop ssv_node && docker rm ssv_node && docker run -d --restart unless-stopped --name ssv_node -e \
CONFIG_PATH=/config.yaml -p 13001:13001 -p 12001:12001/udp -p 15000:15000 \
-v "$(pwd)/config.yaml":/config.yaml \
-v "$(pwd)":/data \
-v "$(pwd)/password":/password \
-v "$(pwd)/encrypted_private_key.json":/encrypted_private_key.json \
-it "ssvlabs/ssv-node:latest" make BUILD_PATH="/go/bin/ssvnode" start-node && \
docker logs ssv_node --follow
Checklists for Troubleshooting
Most checklists below assume you already ran the benchmarking tool. If you have not, go to SSV-Pulse Benchmarking first, then return here.
The table below lists common symptoms, likely causes, and the section to use next.
| Observed issue | Common cause | Solution |
|---|---|---|
| SSV 0 peers and connections | SSVAPIPort is closed. | Open the port on the container. Default value in config is 16000. |
| SSV 0 inbound connections (poor SSV performance) | P2P ports are closed. | Expose the ports on SSV container and externally on your firewall too. |
| Execution 0 peers | net namespace is disabled. | Enable the namespace or check the peer count on your monitoring. |
| Execution peer count (unstable sync progress) | --maxpeers value is too high or too low. | Adjust the maxpeers value as per your client’s documentation. |
| Consensus and/or Execution latency | Nodes are too far from each other, or the network side is misconfigured. | Relocate your nodes closer to each other, or adjust the network side. |
| Consensus peer count (Sync and performance issues) | --maxpeers value is too high or too low. | Adjust the maxpeers value as per your client’s documentation. |
| Consensus missed blocks (Sync issues) | Multiple potential sources. | Need to investigate bottlenecks, described in the section. |
| RAM and CPU high usage | Not enough resources for the number of managed validators. | Adjust the resources in accordance with our recommendations. |
| Clients’ versions | Didn’t upgrade clients timely. | Upgrade clients to the latest stable version. |
| Network congestion / Concurrent connections | Usually, limited by the ISP. | Explore options to expand limitations of your network. |
| Disk performance | Not enough space / Disk is not performant enough / Didn’t optimize usage. | Install mentioned optimization and/or upscale disk. |
SSV 0 Peers
If SSV shows 0 peers and 0 connections, the tool usually cannot reach your health endpoint. The most common cause is that port 16000 is not exposed on the container or host. The same applies if you run SSV Node with systemd.
Solution
- Open
SSVAPIPorton the SSV container. The default value is16000, but it can be changed inconfig.yaml. - If you run SSV Node as a
systemdservice, expose the same port externally and query it through the machine's IP address if needed. - Verify locally with
curl http://localhost:16000/v1/node/health.
SSV 0 inbound connections
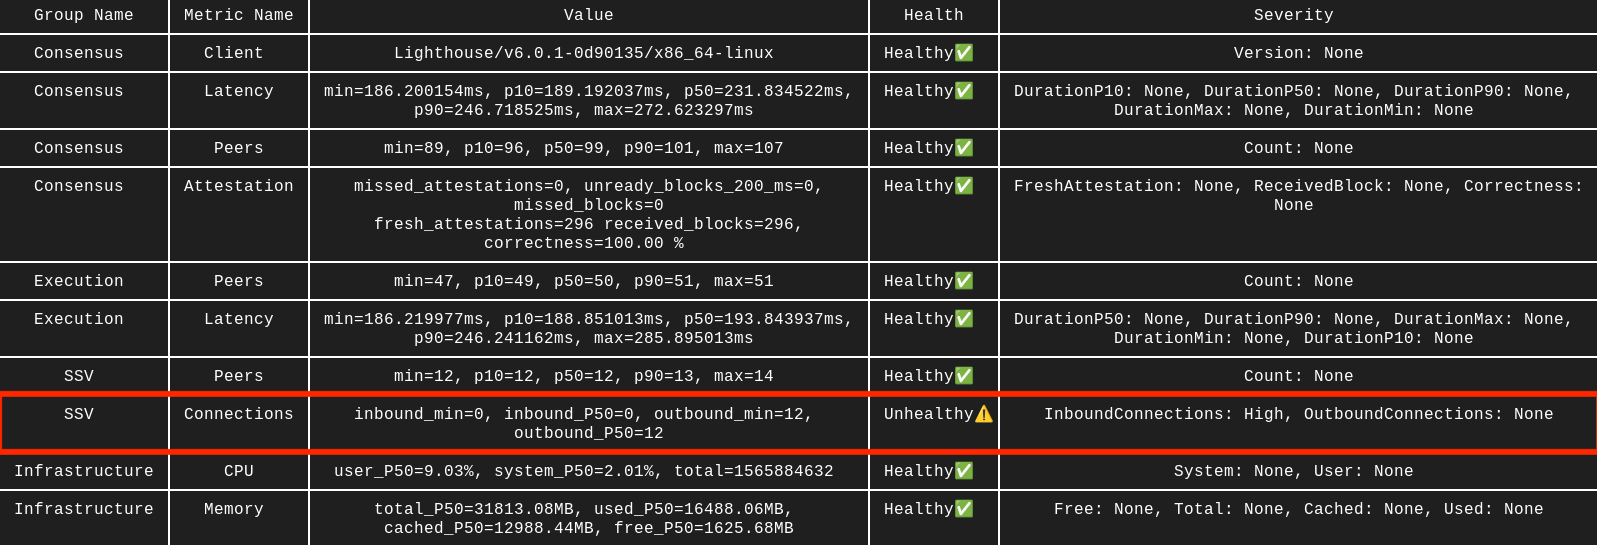
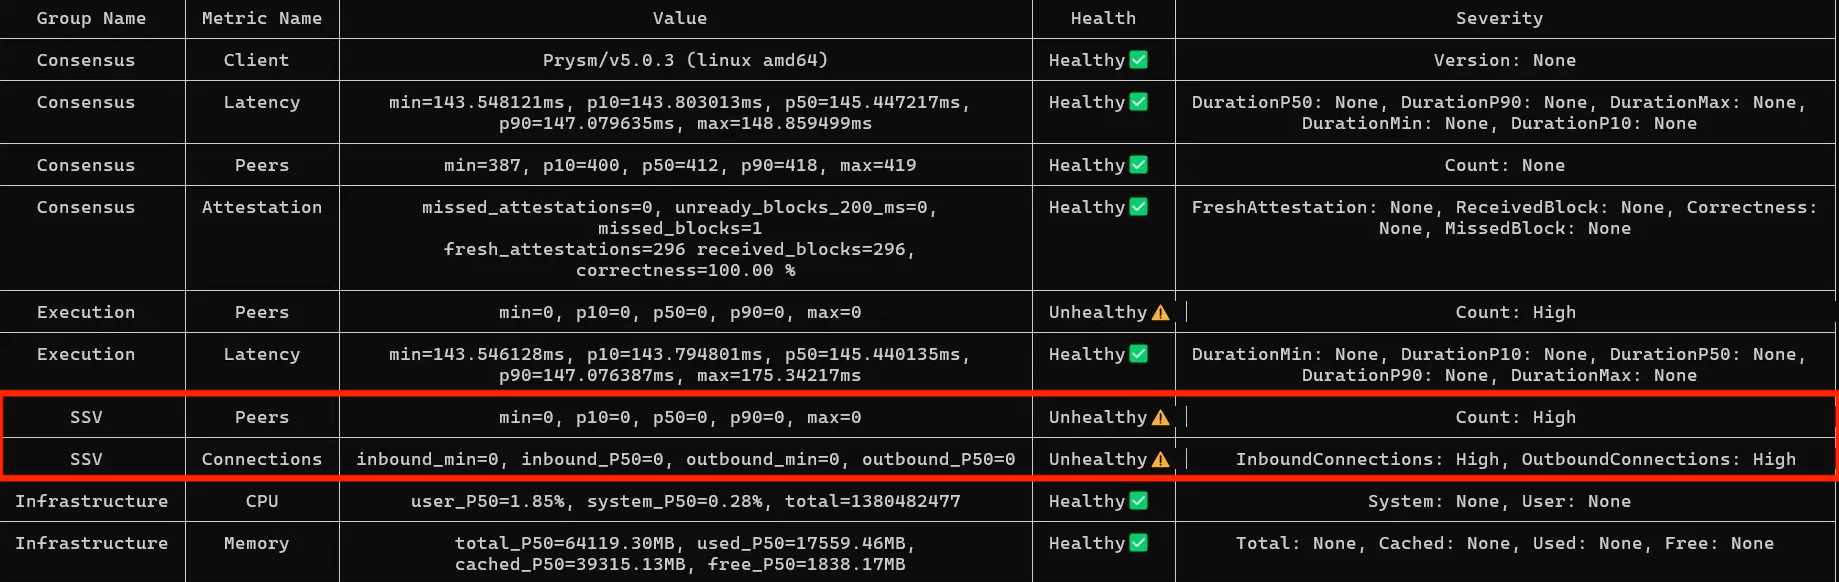
The healthy number of SSV peers is usually 10-30, depending on how many clusters you participate in. Make sure you see both inbound and outbound connections. If inbound stays at 0, your P2P ports are likely closed.
In this example, the SSV node has peers and outbound connections, but 0 inbound connections. That usually points to incorrect P2P port exposure or firewall rules.
Solution
The most common cause of SSV issues is closed P2P ports. Double-check that 12001 UDP and 13001 TCP are open, or the custom values from your config:
- on your VPS firewall
- in any local firewall tool, for example
ufw - on the Docker container
- in the config file, if you changed the defaults
The same applies to RPC ports on your Execution and Consensus nodes. If SSV Node cannot reach them, it will not work correctly.
Another common cause of poor performance is future msg from height. This means a received message has a timestamp from the future, usually because clocks differ across machines. Install and use chrony to keep timestamps in sync.
Execution 0 peers
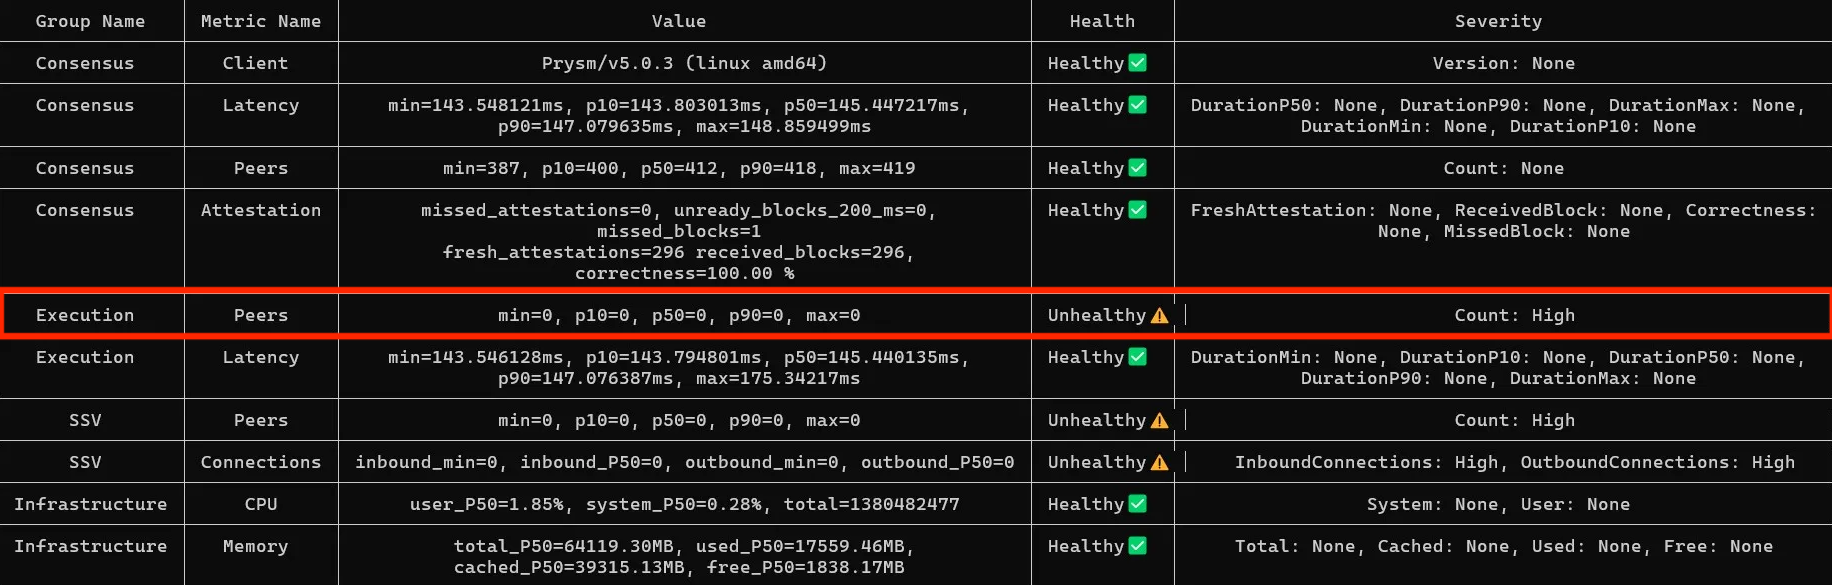
If the Execution node shows 0 peers but latency data is present, the node likely has peers and the benchmark tool just cannot query net_peerCount because the net namespace is disabled.
Solution
- If you already monitor the Execution node, check the peer count on that dashboard.
- Otherwise, enable the
netnamespace:- How to do it on Geth (
--http.api) - And on Nethermind (
JsonRpc.AdditionalRpcUrls).
- How to do it on Geth (
Execution peer count
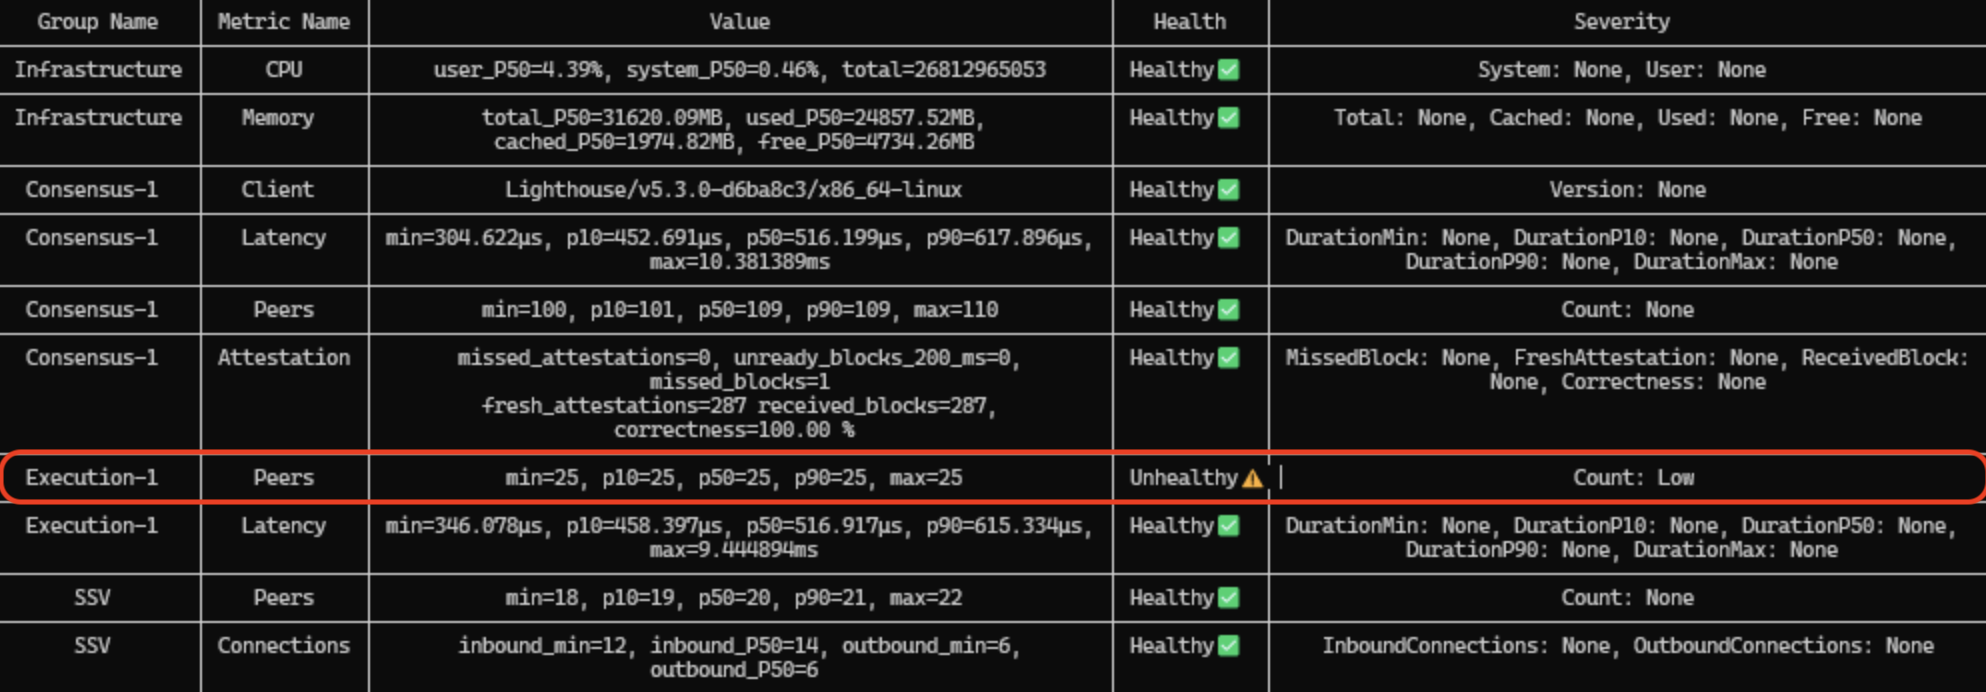
The healthy number of Execution peers is usually 25-75, depending on the client and its recommended --maxpeers value. The tool does not account for client-specific defaults.
In this example, the client is Besu and 25 is the default maxpeers value, so the result is healthy. On Geth, 25 would be low because the default is 50. If the peer count is unusually low or unstable, your ISP may be limiting concurrent connections. This is common in home setups.
Solution
- Adjust
--maxpeersto the value recommended in your client's documentation, then restart the Execution node. - If you suspect the issue is with concurrent connection limit, refer to the relevant section here.
Consensus or Execution latency
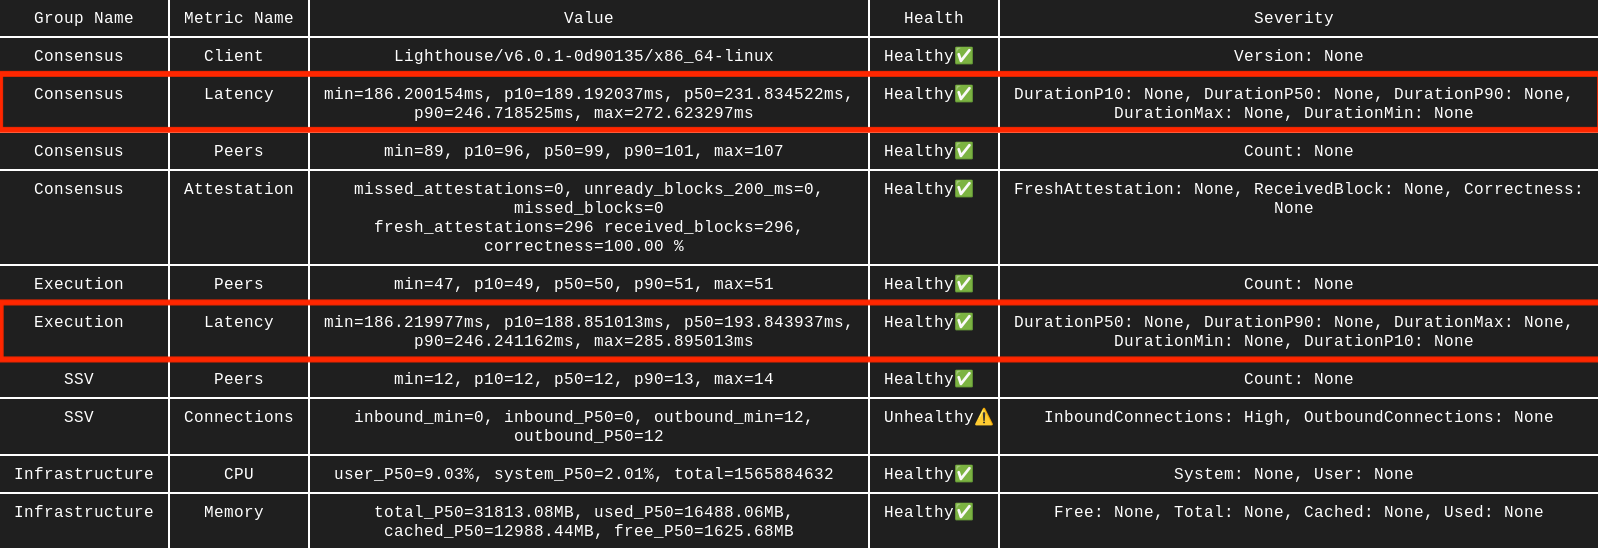
If SSV, Execution, and Consensus run on the same server, latency should usually be 10 ms or lower. Running them on different servers is less efficient and often results in latency closer to 150 ms. Higher values usually indicate a problem.
Solution
- Move the nodes closer together. For best performance, run SSV, Execution, and Consensus on the same server.
- If latency is over 150 ms even for nearby nodes, your network may be congested. See Network congestion.
- If you run nodes across several servers, use an NTP service such as chrony and consider TCP BBR congestion control.
Consensus peer count
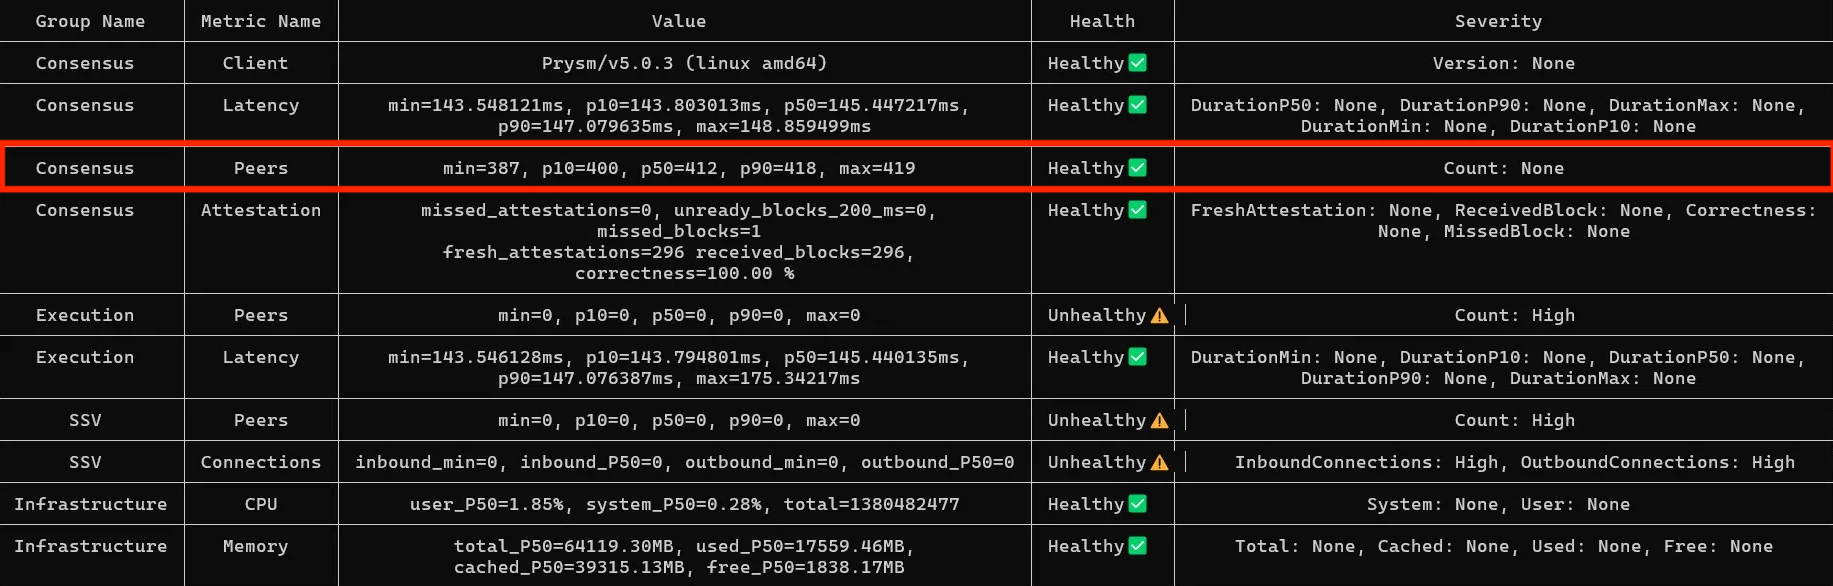
By default, Consensus node maxpeers is usually in the 50-150 range, depending on the client.
Peer count is a trade-off: too few peers can cause sync issues, while too many can consume bandwidth and delay RPC calls.
Solution
- Stick to the
maxpeersvalue recommended in your client's documentation:--p2p-max-peers=70for Prysm--target-peers=100for Lighthouse--p2p-peer-upper-bound=100for Teku
Consensus missed blocks
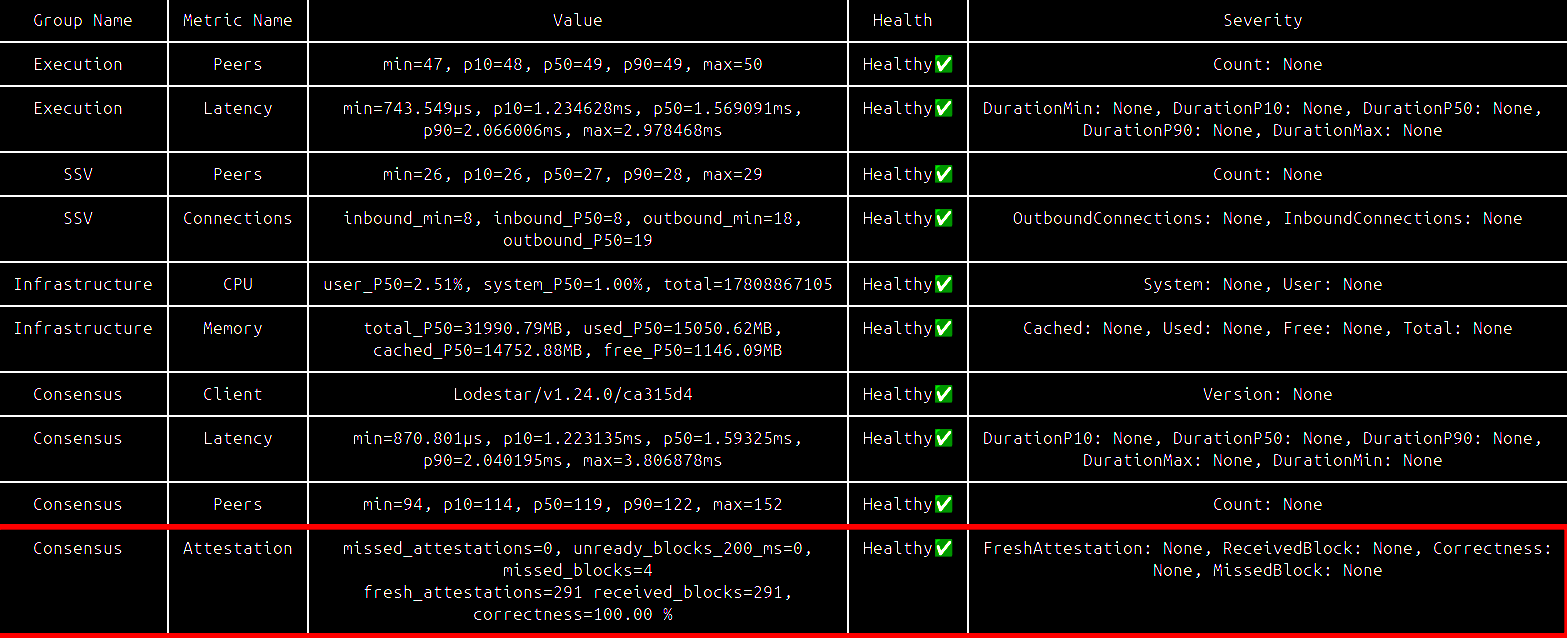
In the Consensus - Attestation section, check missed_blocks.
The healthy range is usually 0-2. If the value is significantly higher, check sync progress on both the Execution and Consensus nodes.
This issue can come from several sources, including configuration errors and hardware bottlenecks. Cross-check it with the log analyzer tool.
Solution
- Make sure peer counts are healthy for both the Consensus and Execution nodes. See the sections above.
It may also come from hardware bottlenecks:
- Your disk may not have enough free space, or its IOPS may be too low to keep up with new blocks. Regular pruning may help. If not, upgrade the hardware.
- You may not have enough RAM and / or CPU. Adjust available resources for the affected node. Weekly restarts may help slightly, but persistent issues usually require more capacity.
RAM and CPU usage
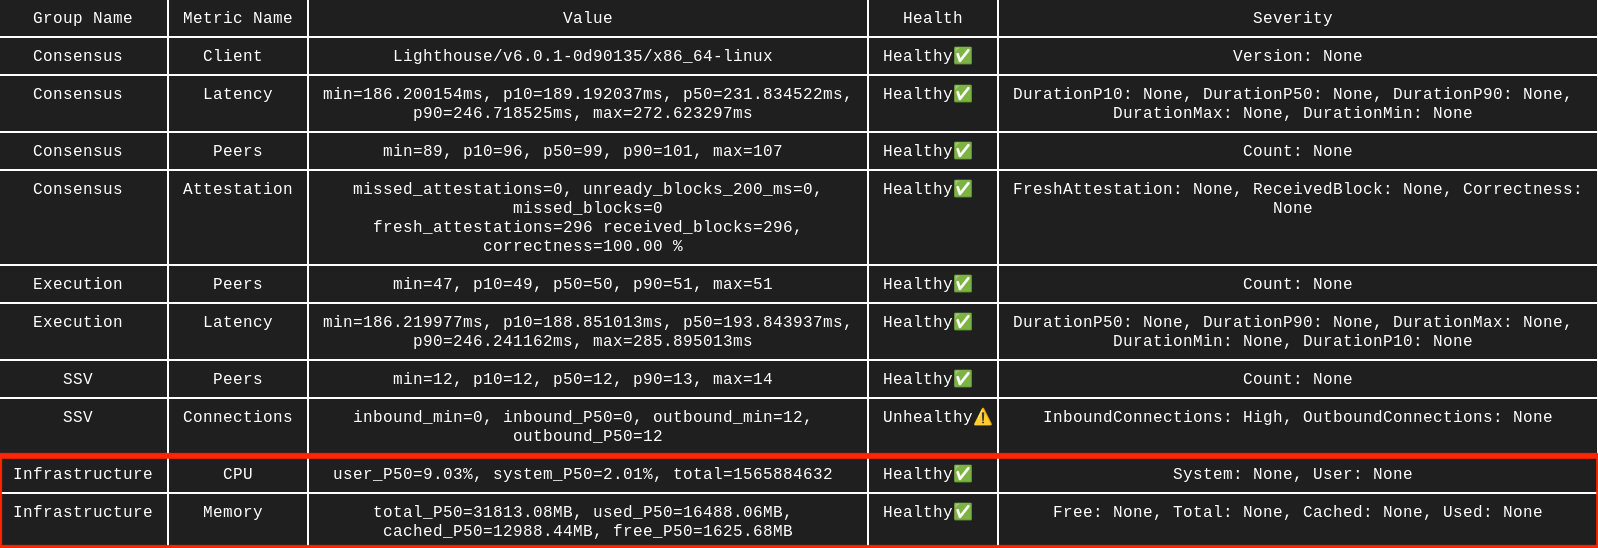
Healthy CPU usage is generally below 30%. RAM depends heavily on the clients you use and usually ranges from 16 GB to 32 GB on Mainnet. Cross-check these values with your own server monitoring, because the benchmark tool has limited visibility into host resources when Docker is involved.
Solution
CPU
CPU issues usually have two fixes: optimize or add more capacity. See the Hardware Requirements page for a baseline.
Optimization options:
- Set CPU Governor to Performance, you can follow this StackExchange thread.
- Set Low Latency CPU profile. Most modern BIOS versions have that in place.
- RedHat wrote a great runbook on how to optimize your CPU profile. There is a checklist on page 5 that you can follow. You should also limit the CPU usage for each of your applications/clients. The options are described in the RAM section below, they generally work the same way for both.
RAM
RAM issues usually mean either you do not have enough memory or other applications are overusing it. Check our hardware recommendations, then apply limits based on your environment:
- Set limits on the Docker containers
- Similar limits for Kubernetes setup
- Set limits with Linux Control group
- Set limits with Linux ulimit
Clients versions
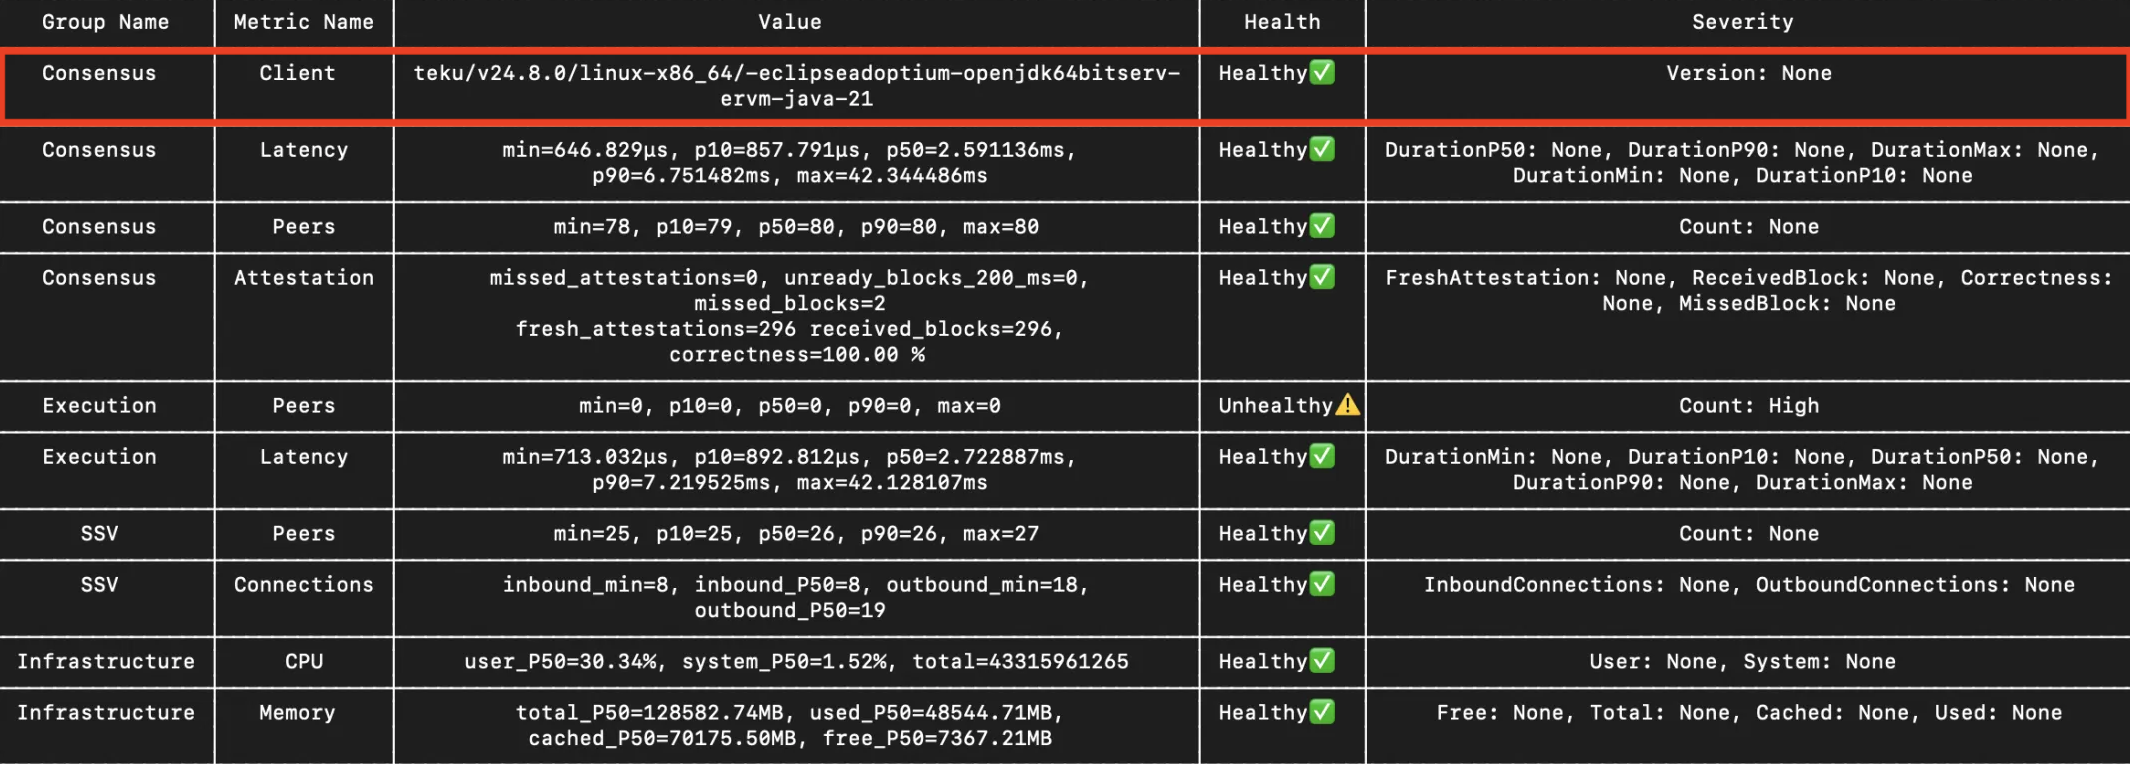
The tool does not warn when a client is outdated. It also checks only the Consensus client version. You must verify the Execution client separately.
In the example, Teku 24.8.0 is already several months old. Outdated versions can cause issues because newer releases are often more stable and performant. SSV Node may also rely on functionality introduced in newer versions.
Solution
To reduce risk, upgrade after a short delay rather than on release day, or test the new version on testnet first.
You can pull the latest image manually, for example docker pull consensys/teku:latest, then restart the client.
Network congestion
The benchmark does not measure these metrics directly, and they can be difficult to observe. Each peer is essentially a concurrent connection and we can estimate the total number:
- Consensus - 100-150 peers
- Execution - 30-75 peers
- SSV - 10-20 peers
- RPC calls and Websocket connections - depends on the load
Your setup therefore needs to handle at least 120 + 50 + 15 = 185 concurrent connections. That does not include WebSocket and RPC calls, so 200 is a practical minimum. The number of managed validators will increase RPC load further.
If concurrent connections are limited, you may see unstable peer counts, sync issues, performance degradation, and delayed RPC calls. The same is true for insufficient bandwidth.
Solution
-
Measure current network usage with provider monitoring or Linux tools such as iperf. Consensus and Execution peer counts can also help you spot saturation.
-
Identify network limits in your setup. Bottlenecks may come from the router, ISP, server provider, or hardware. In some cases you may need to ask the provider directly.
-
Increase the available capacity and optimize the setup. TCP BBR is a common choice for improving congestion control.
Disk performance
This metric is also not included in the benchmark results. In our tests, we used iostat and ioping to assess disk performance.
Low free space is usually easy to spot because one or more nodes enter a restart loop when they cannot write new data. Poor disk performance is harder to identify. In practice, NVMe or at least a strong SSD is the expected standard.
Solution
-
noatimeandswappinesscan improve disk behavior for Ethereum clients. See the eth-docker guide. -
Disk issues usually come from insufficient free space or insufficient IOPS. In cloud or bare-metal environments, scaling up is often the quickest fix. In home setups, you usually need a hardware upgrade.
SSV Node health endpoint
To use this endpoint you'll first need to configure and open a specific port:
- By default, you can use port
16000. - If you want to use another port:
- In
.yamlconfiguration file you can editSSVAPIPort: 16000and restart to apply. - In
.envconfiguration file you can editSSV_API_PORT=16000variable and restart to apply.
- In
- Make sure your SSV node/container has
16000port opened (or other port you chose).
The health check endpoint can be reached using the curl command, for example:
curl http://localhost:16000/v1/node/health
There are other API methods, they're referenced on this doc page.
How to understand the results?
This request will provide a JSON response. Here is an example of response from healthy node:
{
  "p2p": "good",
  "beacon_node": "good",
  "execution_node": "good",
  "event_syncer": "good",
  "advanced": {
    "peers": 19,
    "inbound_conns": 7,
    "outbound_conns": 17,
    "p2p_listen_addresses": [
      "tcp://<X.Y.W.Z>:13001",
      "udp://<X.Y.W.Z>:12001"
    ]
  }
}
This "self-diagnose" report of the node can be useful to make sure that some essential indicators have the correct values:
p2p_listen_addressesshould show the correct public IP & port and the TCP port should be open when checking this IP with a port checker (they have been rendered anonymous for the purpose of this page)peersshould be at least 15 for operators with more than 100 validatorsinbound_connsshould be at least 20% of the peers (though not an exact number, this is a good indication of healthy connections from the node)
Below, an example of the same report, from a node in bad state:
{
  "p2p": "bad: not enough connected peers",
  "beacon_node": "good",
  "execution_node": "good",
  "event_syncer": "good",
  "advanced": {
    "peers": 5,
    "inbound_conns": 0,
    "outbound_conns": 4,
    "p2p_listen_addresses": [
      "tcp://<X.Y.W.Z>:13004",
      "udp://<X.Y.W.Z>:12004"
    ]
  }
}
SSV-Pulse benchmarking tool
Before using this tool make sure to open SSV Node Health Endpoint.
Benchmark analyzes SSV, Consensus, and Execution Nodes at the same time. If curious, you can find more details on ssv-pulse GitHub page.
To use this tool you can use docker compose or a docker command below:
- SSV Stack
- docker run
- docker compose
If you did setup your SSV node with the SSV Stack repository, you already have the benchmark tool partially setup.
To run the benchmark tool:
- Open
docker-compose.yamlfile in yourssv-stackdirectory - Scroll down to the
ssv-pulseservice, at the very bottom - Replace the various addresses with the respective endpoints:
--consensus-addrto your Consensus HTTP, e.g.http://127.0.0.1:5052--execution-addrto your Execution HTTP, e.g.http://127.0.0.1:8545- If you run a Hoodi node you should uncomment
--network=hoodi(delete #) - If you run this on a arm64 machine you should uncomment
--platform linux/arm64
- Run
docker compose run ssv-pulse
Use the following command to run the benchmark tool:
docker run --rm --network=host --pull=always --name ssv-pulse \
ghcr.io/ssvlabs/ssv-pulse:latest benchmark \
--consensus-addr=REPLACE_WITH_ADDR \
--execution-addr=REPLACE_WITH_ADDR \
--ssv-addr=REPLACE_WITH_ADDR \
--duration=60m
Replace the various addresses with the respective endpoints, e.g. http://lighthouse:5052, http://geth:8545, and SSV http://ssv_node:16000 (or your other SSVAPIPort).
- If you run a Hoodi Node you should add
--network=hoodito the command. - If you run this on a arm64 machine you should add
--platform linux/arm64to the command.
If you used docker compose to run your SSV node — add the following part after the services: to your docker-compose.yml file:
services:
  ssv-pulse:
    container_name: ssv-pulse
    image: ghcr.io/ssvlabs/ssv-pulse:latest
    command:
      - 'benchmark'
      - '--consensus-addr=<YOUR_ADDRESS_HERE>' # Change to Consensus Node's address, e.g. http://lighthouse:5052
      - '--execution-addr=<YOUR_ADDRESS_HERE>' # Change to Execution Node's address, e.g. http://geth:8545
      - '--ssv-addr=<YOUR_ADDRESS_HERE>' # Change to SSV Node's address, e.g. http://ssv_node:16000
      - '--duration=60m'
      # - '--network=hoodi' # Add this if you run a Hoodi Node
      # - '--platform linux/arm64' # Add this if you run on an arm64 machine
    networks:
      - host # This allows ssv-pulse to access any docker container hosted on the machine
            # Alternatively, you can use your existing network instead. Check with docker network ls.
    pull_policy: always
Then run docker compose up ssv-pulse to run the benchmark tool.
Use the Value column as the ultimate validation tool. Don't just look at the Health column, as this can sometimes be misleading.
Now you can get back to the Checklists for Troubleshooting to interpret results.
SSV-Pulse log analysis
The same SSV-Pulse is capable of analysing your logs and also logs of other nodes. This is especially useful if you have access to logs of all nodes in the cluster (e.g. you're running the whole cluster yourself).
If curious, you can find more details on ssv-pulse GitHub page.
To use this tool follow the steps below:
- Locate debug log files. Usually they're in the same folder as config and named
debug-2025-03-10T....log - Copy one or several log files into a new folder
cdinto that folder- Run the command below:
docker run --rm --pull=always -v .:/logs ghcr.io/ssvlabs/ssv-pulse:latest analyzer --log-files-directory=/logs
Log files need to be placed in a fresh new directory. Otherwise you might see an error panic: invalid character '\x00' looking for beginning of value.
Tool will automatically detect the Node ID for each log file. If you have logs from multiple nodes - we recommend choosing logs with similar timestamps.
How to read the results?
Let's look at example of output when analyzing logs of a single node:
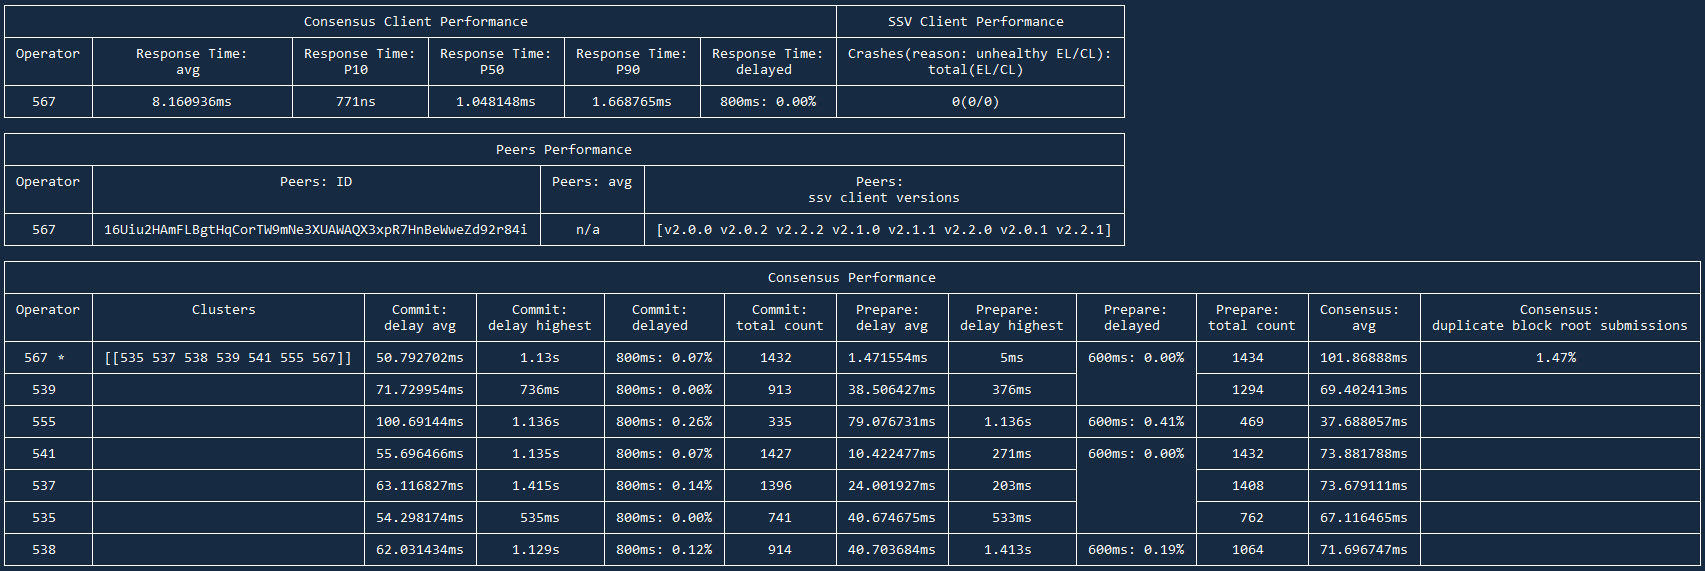
Results are divided into 3 sections:
- Consensus and SSV Clients Performance
- Peers Performance
- Consensus Performance
Let's examine and understand each of the sections:
Consensus and SSV Clients Performance
Here you will find Response Time of your Consensus node, so how timely Consensus node responds to requests from SSV node.
Response time: avg for local setups should be within 1-20ms range. If your SSV and Consensus nodes are on separate instances, this number can go up to 150ms. It's always better to keep this number as low as possible of course.
Response time: delayed shows how many requests were delayed for >800ms. This should be 0.00%. Anything >0.20% shows that Consensus can have significant delays which will affect your Correctness.
On the right side you will see SSV Client Performance and its Crashes. If your EL or CL were out of sync or you restarted any of the nodes — your SSV node will have these Crashes. This number should be 0, if you see any unexpected restarts, it's a solid sign you have sync issues on one of the nodes.
Peers Performance
This section shows average number of peers, their versions, your peer ID. There is little insight here, you can treat this section as JFYI.
Consensus Performance
Here you will find data on how your node interacts with other nodes in the cluster(s). This section is especially useful if you have logs from multiple nodes, as you can spot patterns (e.g. one node has higher delays or lower participation rate).
You will always find your performance as the best in cluster. This is expected as your node doesn't have info from other data points. Actual performance can only be assessed with logs from several nodes.
Commit: delay avg should ideally be < 150ms, it can go up to 300-500ms in normal/suboptimal scenarios. Anything >500ms is a reason for concern. Either your node is located really far away from other nodes or you have networking issues.
Commit: delayed can show which nodes are regularly late to submit their commit messages. That can signalize their performance issues or that your nodes are located too far from each other.
Commit: total count and Prepare: total count show # of Prepare and Commit messages occured in these logs. It is expected that host node (marked by *) will always have higher # of messages. Sometimes nodes can have high # of Prepare count while lower Commit count, that is usually a sign of networking and/or Consensus node issues on this node's side.
Consensus: duplicate block root can show issues with Consensus node and the blocks it syncs. Healthy number is 1-4%, anything >10% is a sign your Consensus node has an issue. You might have to re-sync your db or switch the Consensus client completely.
Reach out to other network operators on our Discord channel